

Some parts are simply not made for a stylus. Freeform surfaces, thin sheet metal, soft plastics, fragile or flexible components, and castings with no obvious features to probe: for all of them, taking a few discrete points means describing a complex shape with very little information.
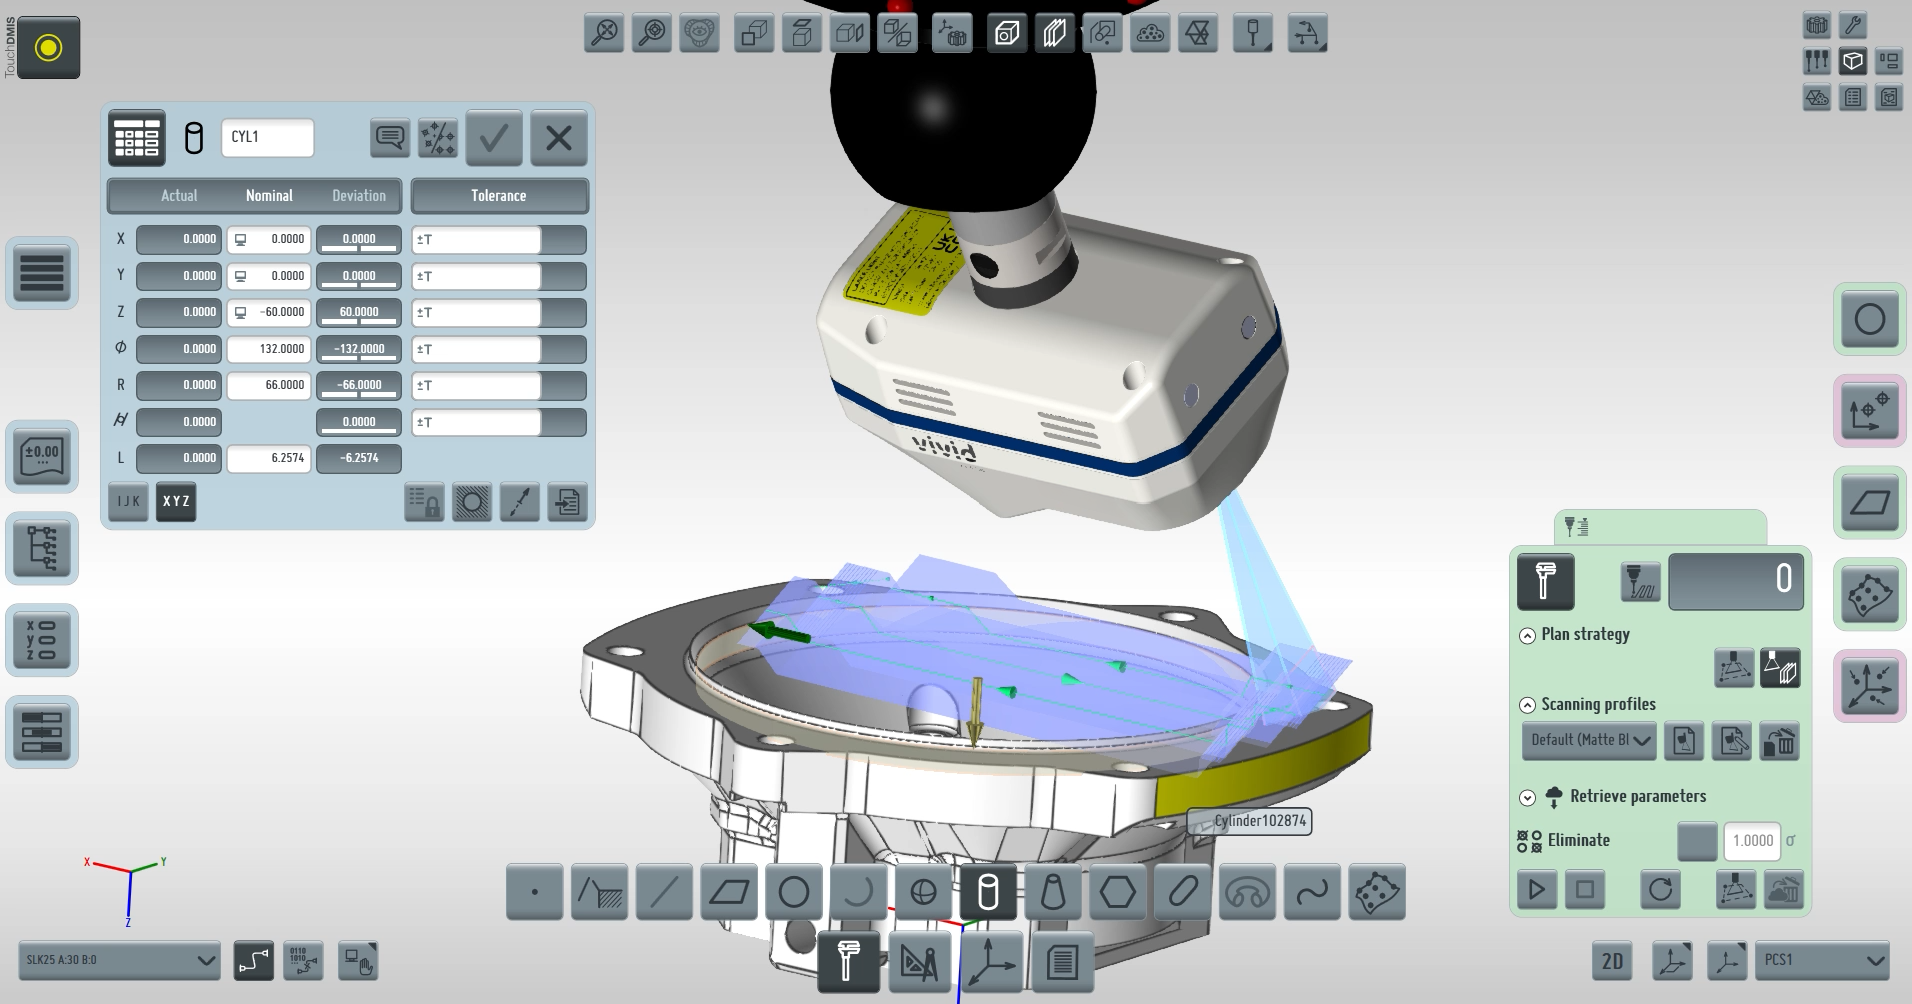
The laser scanner integration in TouchDMIS brings non-contact measurement into the same full-touch environment you already use for tactile inspection. Instead of a handful of points, you capture hundreds of thousands of points per second and work on the complete surface of the part, with the same simplicity that defines TouchDMIS.
No second software. No data conversion. No separate alignment.
See in action
A tactile probe answers the question “where is this point?”. A laser scanner answers the question “what does this part actually look like?”.
Because the sensor never touches the part, measurement is fast, repeatable and non-destructive. There is no probe deflection, no stylus compensation to manage, and no risk of marking or deforming delicate components. This makes laser scanning the natural choice for:
- Freeform and organic surfaces that resist point-by-point measurement
- Thin, flexible or soft parts that a stylus would push out of position
- Fragile, polished or finished components that must not be touched
- Large surface areas where full coverage matters more than single features
- Parts with no CAD model, to be digitised for reverse engineering
FROM POINT CLOUD TO MESH
Every scanning pass produces a dense point cloud: a three-dimensional map of the real geometry of the part, acquired directly from the surface.
TouchDMIS lets you turn that cloud into a mesh, a triangulated model where neighbouring points are connected into surfaces to form a continuous polygonal representation of the component. The mesh is easier to read on screen, easier to handle and easier to share than a raw cloud, and it is the basis for surface comparison and for reverse engineering workflows.
Point cloud and mesh live inside your measuring program, alongside the tactile features, in the same coordinate system and the same alignment.
COLOUR MAPS AND CAD DEVIATION ANALYSIS
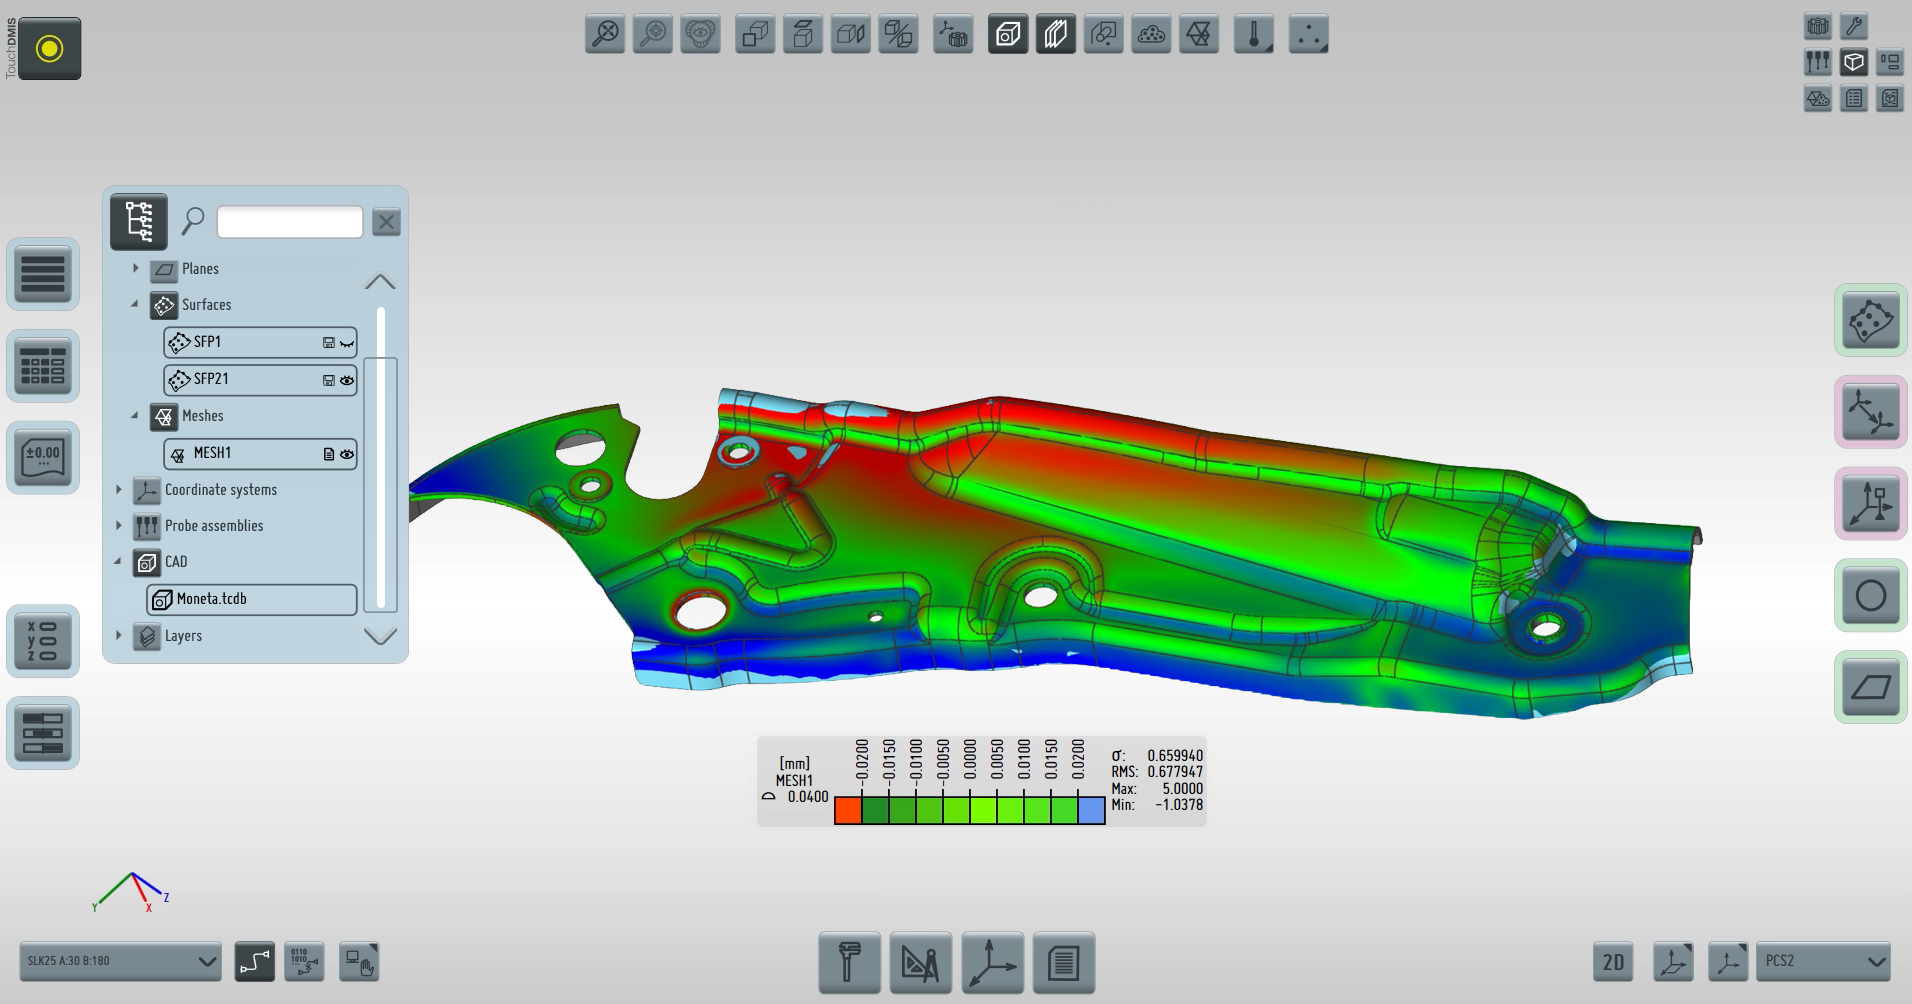
A dimensional report tells you that a value is out of tolerance. A colour map tells you where, how much, and in which direction — at a glance.
TouchDMIS compares the scanned data against the nominal CAD model and displays the deviation as a chromatic map over the whole surface of the part. Areas in tolerance and areas out of tolerance are immediately visible, in a form that anyone can understand: quality, production, tooling, and the customer.
That visual reading is exactly what you need to:
- Reveal warpage, springback, sink marks and local distortion over an entire surface
- Show the effect of a process change before and after, on the same part
- Identify missing, added or mislocated features on complex components
- Guide die and mould corrections by showing exactly where material is high or low
- Communicate an inspection result without a single table of numbers
Enjoy the TouchDMIS community.
Subscribe to our newsletter!